Overview
Want to build a pretty dashboard to show bandwidth utilisation on your Internet link or your internal network? Read on..
Prerequisites
You'll need the following:
- A Fortigate firewall with sflow support (4.0 MR2+)
- A Splunk Storm project
- A Linux server (Raspberry Pi is perfect)
- Basic knowledge in navigating a Linux console of FortiOS CLI
Configuration
The general approach is as follows:
- FortiOS sends sflow messages to a Linux server
- Linux server writes these messages to syslog
- Syslog is configured to forward messages to Splunk Storm
- Splunk Storm is configured to extract sflow events and graph them
FortiOS
To configure the firewall, issue the following commands at the FortiOS CLI.
Enable sflow and configure collector IP:
Enable sflow and configure collector IP:
config system sflow
    set collector-ip
end
Enable sflow on the both internal and external interfaces:
We need a small Linux server to receive sflow traffic from the firewall and forward it as syslog messages to Splunk. I am using an old Raspberry Pi for this, running Debian 7.4.
First, you need to download, build and install sflowtool as described in the link, but broadly the procedure is:
config system interface
    edit "internal"
        set sflow-sampler enable
        set sample-rate 512
        set polling-interval 30
    next
    edit "external"
        set sflow-sampler enable
        set sample-rate 512
        set polling-interval 30
    next
end
Syslog
We need a small Linux server to receive sflow traffic from the firewall and forward it as syslog messages to Splunk. I am using an old Raspberry Pi for this, running Debian 7.4.
First, you need to download, build and install sflowtool as described in the link, but broadly the procedure is:
[pi@rpi ~]# sudo mkdir /opt/sflow
[pi@rpi ~]# cd /opt/sflow
[pi@rpi ~]# sudo wget http://www.inmon.com/bin/sflowtool-3.22.tar.gz
[pi@rpi ~]# sudo tar -xvzf sflowtool-3.22.tar.gz
[pi@rpi ~]# cd sflowtool-3.22
[pi@rpi sflowtool-3.22]# sudo ./configure
[pi@rpi sflowtool-3.22]# sudo make
[pi@rpi sflowtool-3.22]# sudo make install
[pi@rpi ~]# sudo vim /etc/rsyslog.conf

# logging to Splunk Storm (via TCP)
*.* @@tcp..data.splunkstorm.com:
Supervisord
In order to ensure our sflow collector is always collecting events and forwarding them to syslog, we can use supervisord and a helper script on our Linux server as follows:
[pi@rpi ~]# sudo vim /opt/sflow/sflowlogger.sh

#!/bin/bash
/usr/local/bin/sflowtool -l | logger -t sflow

[pi@rpi ~]# sudo chmod +x /opt/sflow/sflowlogger.sh
[pi@rpi ~]# sudo apt-get install supervisor
Once installed, configure it to start sflowtool and logger using the helper script:
[pi@rpi ~]# sudo vim /etc/supervisor/conf.d/sflow.conf

[program:sflow]
command=/opt/sflow/sflowlogger.sh
directory=/opt/sflow
process_name=%(program_name)s
autostart=true
autorestart=true
stopasgroup=true
stdout_logfile=/opt/sflow/sflow.log
redirect_stderr=true
stopsignal=KILL

[pi@rpi ~]# sudo supervisorctl reread
[pi@rpi ~]# sudo supervisorctl start sflow
[pi@rpi ~]# sudo supervisorctl status
sflow                            RUNNING    pid 5551, uptime 0:05:49
Splunk Storm
Splunk Storm is a hosted Splunk service, which at the time of writing is free to 20GB of log data. this is plenty for a home network sending periodic bandwidth measurements.
First login to your Splunk Storm account and set up a few things:
Save this search as a report called "sflow".
Lastly, create a dashboard with a couple of dynamic drop-down boxes, so you can easily visualise your bandwidth consumption:
You should get a pretty dashboard, which looks something like this:

First login to your Splunk Storm account and set up a few things:
- Click "Explore Data" button under your project.
- Click the gear symbol at the top right and click "Event types".
- Create a new event type called "sflow" with search string "sourcetype=syslog sflow CNTR" and tag "sflow".
- Click the gear symbol at the top right and click "Tags".
- Create a new tag called "sflow" with field/value pair "eventtype=sflow".
- Click the gear symbol at the top right and click "Fields", then click "Field extractions".
- Create a new field extraction called "EXTRACT-sflow-fields" with the following regex:
(?[0-9.]+),(?\d+),(?\d+),(?\d+),(?\d+),(?\d+),(?\d+),(?\d+),(?\d+),(?\d+),(?\d+),(?\d+),(?\d+),(?\d+),(?\d+),(?\d+),(?\d+),(?\d+),(?\d+),(?\d+)
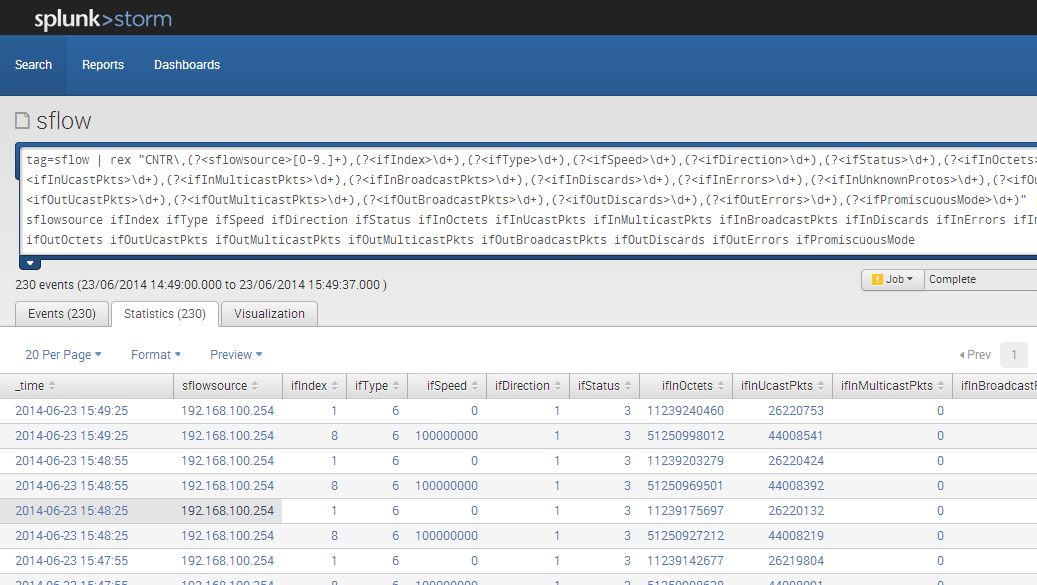
- Click on "Search" at the top left
- Run the following search:
tag=sflow | head 10
Save this search as a report called "sflow".
Lastly, create a dashboard with a couple of dynamic drop-down boxes, so you can easily visualise your bandwidth consumption:
- Click the gear symbol at the top right and click "Dashboards".
- Create a new dashboard called "bandwidth" and paste the following code into it
<form>
  <label>bandwidth</label>
  <fieldset autoRun="true" submitButton="false">
    <input type="time" searchWhenChanged="true">
      <default>Last 60 minutes</default>
    </input>
    <input type="dropdown" token="aggr" searchWhenChanged="true">
      <label>Aggregation</label>
      <default>Minute</default>
      <choice value="1s">Second</choice>
      <choice value="1m">Minute</choice>
      <choice value="1h">Hourly</choice>
      <choice value="1d">Daily</choice>
      <choice value="1w">Weekly</choice>
      <choice value="1mon">Monthly</choice>
      <choice value="1y">Yearly</choice>
    </input>
    <input type="dropdown" token="interface" searchWhenChanged="true">
      <label>Interface</label>
      <default>Internal</default>
      <choice value="1">External</choice>
      <choice value="8">Internal</choice>
    </input>
  </fieldset>
<row>
    <chart>
      <searchstring>
        tag=sflow ifIndex=$interface$
        | streamstats window=2 current=t global=f first(ifInOctets) as f_ifInOctets last(ifInOctets) as l_ifInOctets first(ifOutOctets) as f_ifOutOctets last(ifOutOctets) as l_ifOutOctets by ifIndex
        | eval ifInOctets=abs(l_ifInOctets - f_ifInOctets)
        | eval ifOutOctets=abs(l_ifOutOctets - f_ifOutOctets)
        | eval in_mbps=ifInOctets * 8 / 2014 /2014
        | eval out_mbps=ifOutOctets * 8 / 2014 /2014
        | timechart span=$aggr$ mean(in_mbps) mean(out_mbps)
      </searchString>
      <earliesttime>$earliest$</earliestTime>
      <latesttime>$latest$</latestTime>
      <option name="charting.axisTitleX.visibility">visible</option>
      <option name="charting.axisTitleY.visibility">visible</option>
      <option name="charting.axisX.scale">linear</option>
      <option name="charting.axisY.scale">linear</option>
      <option name="charting.chart">area</option>
      <option name="charting.chart.nullValueMode">gaps</option>
      <option name="charting.chart.sliceCollapsingThreshold">0.01</option>
      <option name="charting.chart.stackMode">default</option>
      <option name="charting.chart.style">shiny</option>
      <option name="charting.drilldown">all</option>
      <option name="charting.layout.splitSeries">0</option>
      <option name="charting.legend.labelStyle.overflowMode">ellipsisMiddle</option>
      <option name="charting.legend.placement">right</option>
    </chart>
  </row>
</form>
You should get a pretty dashboard, which looks something like this:
References
I've used the following reference material to prepare the solution described in this article. Many thanks to the respective authors.
- sflowtool blog: Monday, December 5, 2011
- How To Install and Manage Supervisor on Ubuntu and Debian VPS
- Splunk Storm User Manual: Set up rsyslog
No comments:
Post a Comment